Fast Access To All Your Industrial Production Data With JUNE5 Reporting
In the heart of the digital age, where time is of the essence and information flows faster than a race car down a winding track, businesses need a robust solution to keep pace with the demands of modern industry. Here at iOpen, we’ve harnessed our two decades of industrial and commercial technology excellence to offer you a groundbreaking solution: JUNE5 Pure Web Reporting.

JUNE5: Unveiling the Future of Industrial Data Access
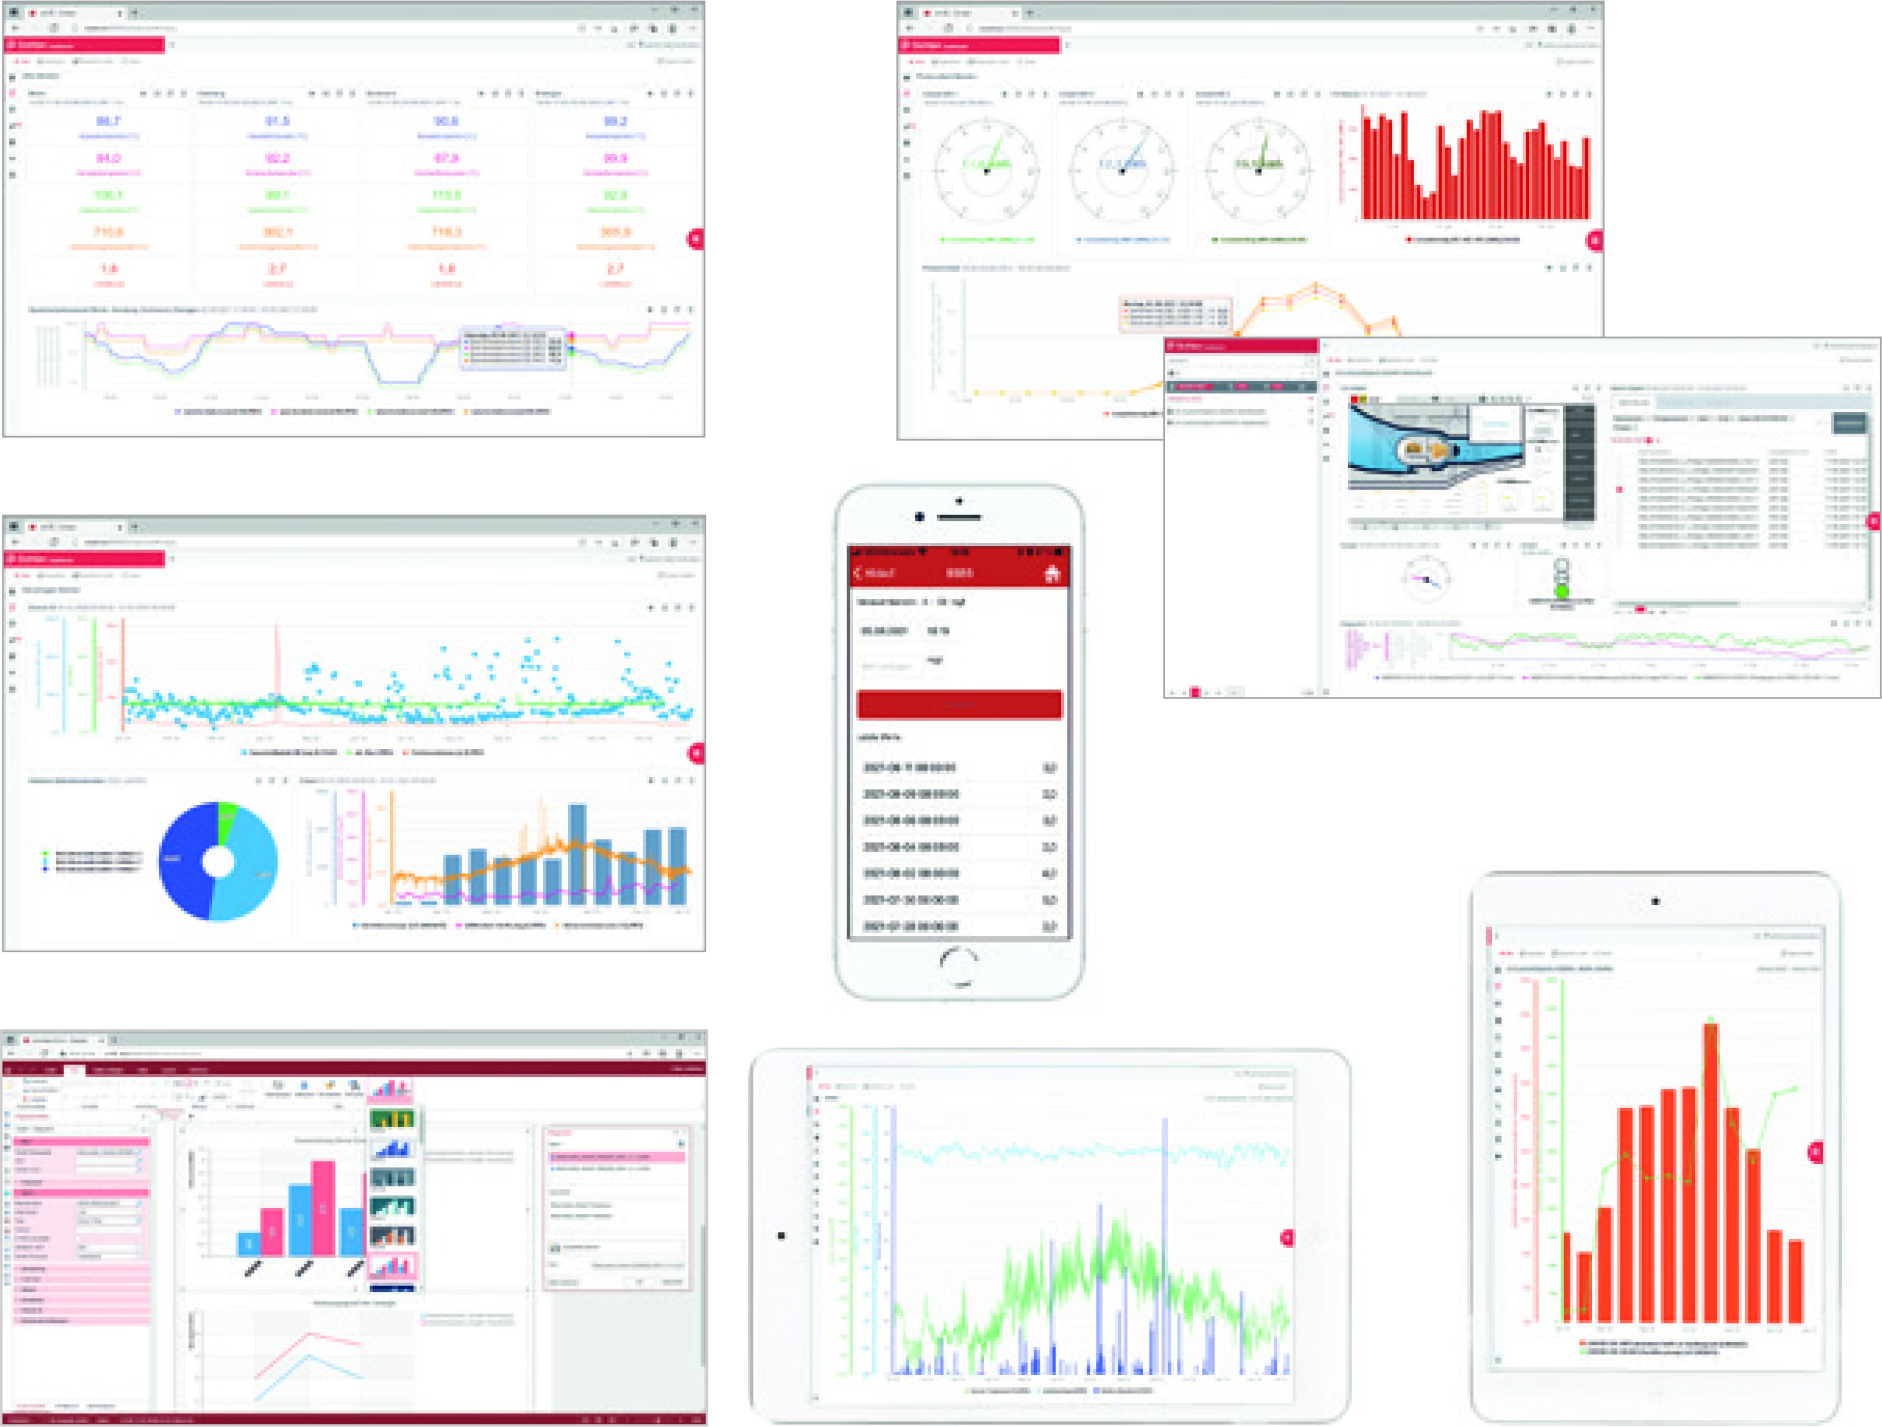
JUNE5 consists of a secure web-based ecosystem designed to offer you a panoramic view of your facilities from anywhere on the planet. No matter the hour, you’ll have real-time access to information, alarms, and data emanating from your industrial installations. How, you might wonder? JUNE5 boasts an intuitive user interface that beckons you to your smartphone or tablet, putting the power at your fingertips. This visual experience is driven by simple gesture controls and promises to elevate your operational efficiency.
Real-time Insights
JUNE5 transforms the way you interact with your data. It provides comprehensive process control through the presentation of information in visually stunning graphs and diagrams. The real-time insights you gain are invaluable, offering you the opportunity to make data-driven decisions with confidence. JUNE5 is also ready for the strategic step towards Industry 4.0. Modern web technology with HTML 5, without the use of plug-ins, is fully implemented in the system approach. This means that JUNE5 can be integrated into a public cloud infrastructure as well as into the more frequently used private cloud.

Pure Web Reports
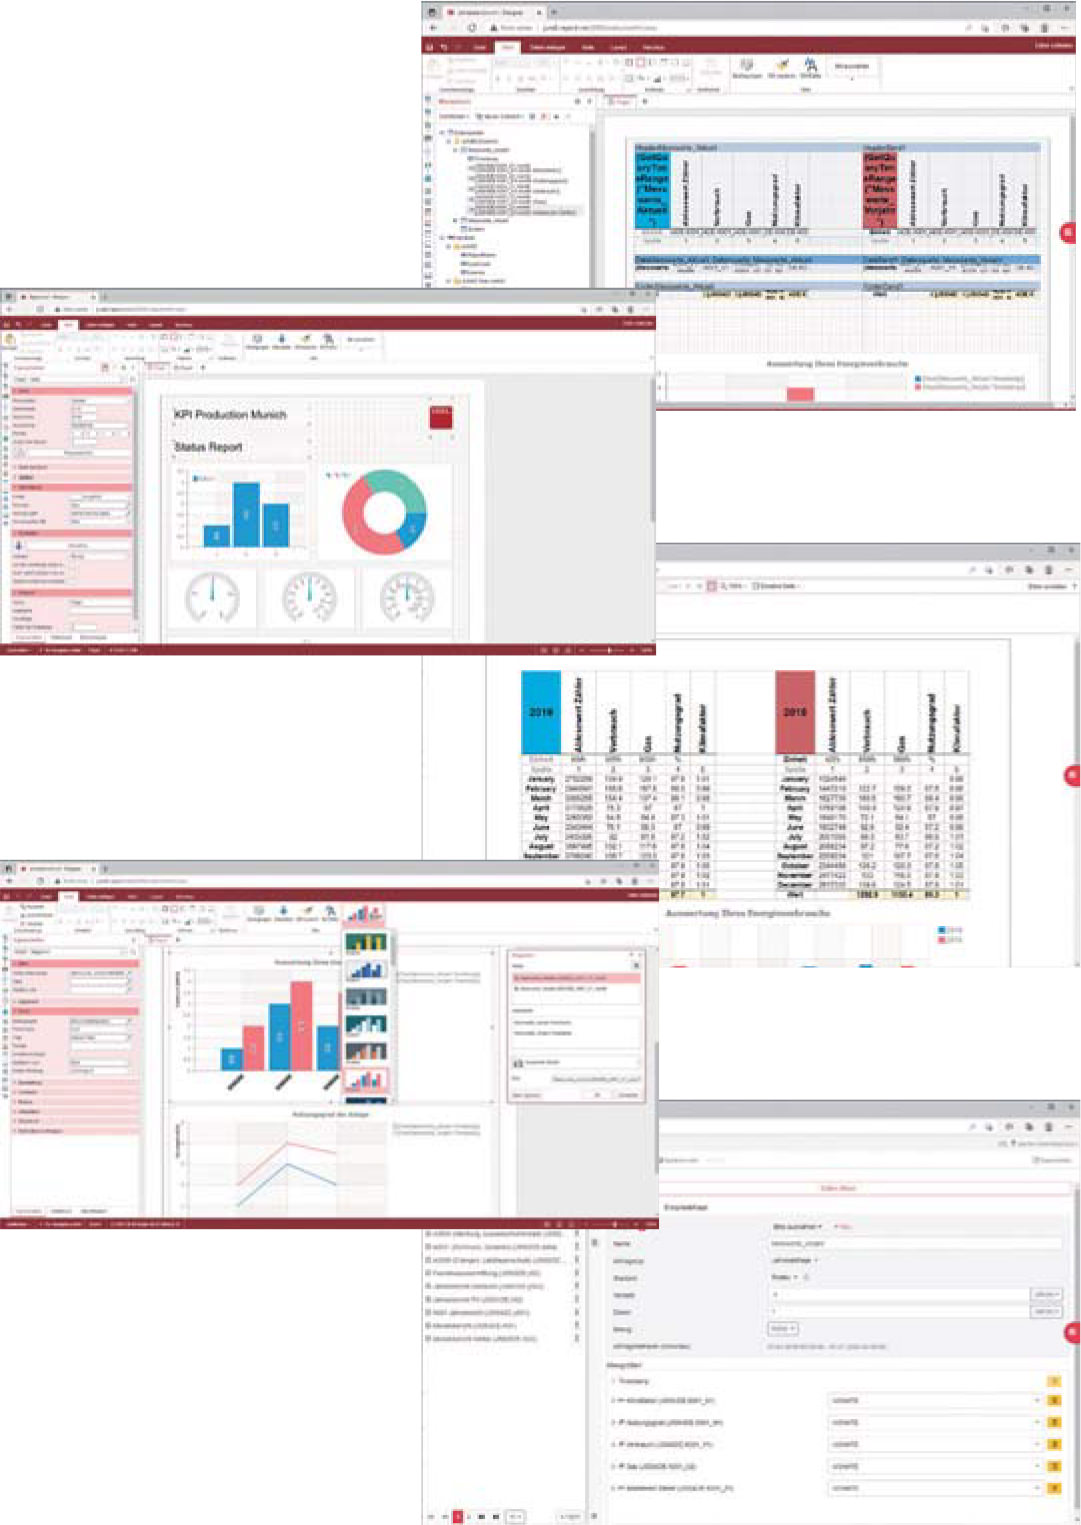
In the age of information, access is key. JUNE5 eliminates the need for intricate software installations. A pure web-based solution, it ensures that you can access your data seamlessly without the hassles of installation and maintenance. Diagrams related to different industries are implemented providing detailed and professional reports. Easy configuration via drag and drop or point and click simplifies the creation of many customizable dynamic reports.
Data Security
Industrial data is the lifeblood of your business. We understand the critical need for data security. JUNE5 provides robust protection for your sensitive information, ensuring your peace of mind. Comprehensive multi-client capability has been implemented with JUNE5. This function makes it possible to assign access rights to different users. Individual rights can be assigned at client level, allowing the respective user to look specifically at different systems or components. User groups can also be created and access rights configured – even across different systems. In addition, access rights of individual user groups can be granted for certain object groups in JUNE5, for example, for areas such as energy, climate, water, etc. This means that you can determine individually who in the company has access to which information.

Visualization
The power of visual representation is immeasurable. JUNE5 excels in this aspect, offering you clear, visually appealing data presentations that maximize your understanding of industrial processes. Your plant is visualised in a hierarchical structure. Each measuring point can be displayed with a short or long designation, depending on the requirements. Individual measured variables are inserted or deselected in the diagram field using the swipe technique or drag & drop. This means that the selected datasets can be linked and displayed in the selected chart type in a matter of seconds.
Industrial Reporting Made Effortless
Need to generate reports for further evaluation and analysis? With JUNE5, it’s a breeze. You can create customized reports tailored to your individual requirements in mere seconds. Your data becomes your ally in achieving your business goals. The values for the graph display can be selected directly in the linked database. By simply swiping the selected lines into the right-hand diagram field, the desired graph is immediately displayed. It is, of course, possible to display several graphs on top of each other. Different time axes can also be displayed simultaneously at any interval you like.
JUNE5 is the answer to your industrial data access needs. It simplifies complex processes and maximizes the potential of your data, ensuring that you are equipped to thrive in the fast-paced world of modern industry. Make the move towards a brighter, data-driven future with JUNE5 reporting.
